Monday, January 30, 2006

Tocqueville Gold 2005 Year-End Review & Outlook


Tocqueville Asset Management
Tocqueville Gold 2005
Year-End Review & Outlook

John Hathaway

In the last 90 days, the price of gold increased 25%, from around $440 to $550. In contrast, it took three years from its bear market low in 1999 for gold to sustain a 25% rise. The shrinkage of time from three years to 90 days to muster a 25% move signifies that the gold market is evolving. The advance is becoming more dynamic and it is certainly making a lot more noise than those early days, when if I recall correctly, it was more interesting to watch the grass grow.

Bull markets can be divided into four phases: the beginning, the end of the beginning, the beginning of the end, and the end. In terms of the road map for gold, I believe the current phase marks the end of the beginning. The "stealth" phase of the gold bull market ended with the fireworks of the last 90 days. The elapsed time of that first phase was the five years from August of 1999 to August of 2005.

Noisy and dynamic market behavior is necessary to attract new money flows. That is what is taking place. More people are talking about it. Media awareness has increased. What is curious is that few can offer explanations as to what is propelling the advance. Many are still on the side lines, frozen in place for fear that it is "too late". Not to worry, many of these will become buyers as the price advance continues and the reasons become more apparent. Finally, when everyone knows the reasons and it becomes obvious why gold is advancing, it will be mark the final days of the bull market. In my opinion, those days are still well ahead of us, both in terms of time that must elapse and the magnitude of price appreciation.

It is ironic that many who had been invested in gold for years cannot stand this new-found prosperity. They see current strength as a fleeting opportunity to cash in.

When I first started writing about the gold market, I thought the gold price could eventually reach four digits (The Investment Case for Gold-January 2002; archived on www.tocqueville.com). That seemed incredible at the time, because, if right, gold would triple. With gold trading at $560/oz as of this writing, $1,000 doesn't seem so far-fetched.

As the bull market has evolved, so has my thinking. Four digits no longer seems like a stretch to me. Rather, it would seem that gold would be correctly priced at $1,000, just to catch up to other commodities like oil, base metals, natural gas, and platinum. We calculate the market cap of all above ground gold, including central bank reserves, equals about 1.4% of global financial assets. In 1934 and 1982, when investor stress reached extreme readings, that percentage was between 20% to 25% (see graph).
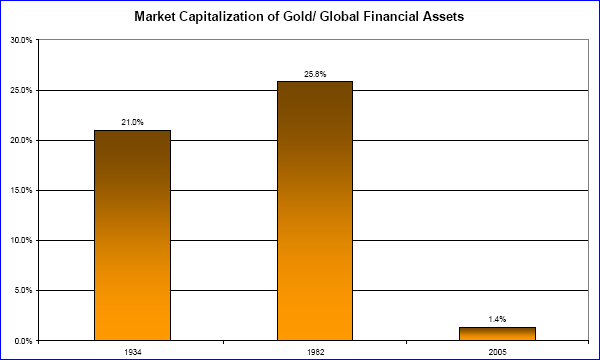
The current very low ratio indicates complacency and suggests that gold could double even if worst case macro economic and geopolitical scenarios fail to materialize. If they were to materialize, the potential for gold would go well into four digit territory. Macro and geopolitical nightmare scenarios are probably motivating some capital flows towards gold. However, we estimate these represent a small fraction of what is driving the price. In terms of investment rationale, it is still possible, and in fact quite commonplace, to make a benign, even Panglossian, case for gold's advance: global asset rebalancing towards "hard assets", of which gold is only a bit player, an incidental subset; continuing prosperity in Asia where there is a cultural affinity for the metal; high cash flow to oil producing countries, many of whom don't particularly like dollar assets; the resounding success of the gold ETF (GLD-NYSE), which enables risk averse investors to buy the financial insurance that gold represents cheaply and efficiently (and in a little over one year has become the 14thlargest holder of gold in the world); and the recent disappearance of the central banking community as sellers.

With respect to global capital markets, it is possible to say that complacency reigns. Eventually, gold will advance for reasons that few are will to talk about: a resumption of the bear market in equities, a slide in the US dollar, and a credit squeeze that could deflate the world economy. In the US, a slowdown in housing is just beginning to materialize. Consumer spending is poised to weaken. How will the Fed respond? One can be certain that their actions will not comfort foreign holders of US dollar denominated reserves.

Our portfolio contains optionality to gold that has yet to surface. With significant exposure to small cap exploration and development companies, we stand squarely in the path of an impending takeover frenzy as large cap producers decide to reprice the economic potential of reserves assuming $500 gold. When they do so, they will abandon their timid ways and become voracious acquisitors of small to mid cap companies. We are seeing early signs of this, and expect this change in behavior to become more evident as the year progresses.


John Hathaway is portfolio manager of the Tocqueville Gold Fund.
www.tocquevillefunds.com
[email protected]

Wednesday, January 25, 2006

IMF Chief Economist Warns of Run on the U.S. Dollar

A run on the U.S. dollar that would see investors rushing to dump the currency is a possibility, although it's difficult to judge how likely an outcome that is, the International Monetary Fund's chief economist said Monday.

With the U.S. current account deficit running at close to 7% of gross domestic product, economists have long expected the dollar to depreciate against other major currencies, and feared the dollar could go into free fall if that prompted international central banks and investors to flee the greenback.

"We are in a risky situation," said Rajan. "You cannot discount a run on the dollar. But you cannot fully quantify that risk at the moment."

"The first action will come from foreign private investors, who have no motives other than returns," he said.


Read the Full Story by Andrew Peaple and Emily Barrett of Dow Jones Newswires here: Run on the U.S. Dollar

Learn more about the coming collapse of the U.S. Dollar by reading the first chapter of The Coming Collapse of the U.S. Dollar and How to Profit from it.

Monday, January 23, 2006

J.P. Morgan Predicts Gold Price of $600 in 2006

In a report put out on Monday by J.P. Morgan Securities, J.P. Morgan predicts that gold prices may reach almost $600 an ounce by the end of 2006 on gold mine supply worries, firming jewellery demand, geo-political concerns and favourable currency environment.

However, J.P. Morgan expects that gold prices might even jump to $800, if Iran's nuclear issue heated up and oil hit $100 a barrel.

"For gold, event risks are surfacing at a time when mining supply was already inadequate and jewellery demand firming. Fundamentals alone justify prices near $600 by year-end, while a meltdown in Iran/spike in crude could see $800 gold," the J.P. Morgan report said.

J.P. Morgan said the gold price was likely to increase from a favourable currency environment, with the dollar seen range-bound in the first half of the current year, while weakening later.

"The recent pullback in gold from its record highs should not be interpreted as a peak, rather we see it as a stage in a longer rally," J.P. Morgan said.

"Gold's bullish hues are based on a stagnant supply profile, rising investor interest in real assets and the influx of petro-dollars from the Middle East," the report said.

Source: J.P. Morgan sees gold near $600/oz by year-end

Bill Murphy of Gata.org had this to say about the J.P. Morgan Report:

"After missing the move up for many years, Morgan turns bullish and calls for $600 gold by the end of the year, or a roaring $46 per ounce from here. Only world shaking events could take gold to its old high. What hogwash!

*No mention of investment demand, only jewelry.

This sort of drivel is why GATA’s Gold Rush 21 DVD is so critical. The most important aspect of the gold market at the moment is the short position and the increasing focus on gold as money. Neither is discussed by Morgan, Barclays or any other report on Planet Wall Street.

What is constructive about this report is it signals how dire the situation is for The Gold Cartel. They are doomed and they know it. This report tells me these bums know their scheme is falling apart. This is nothing more than a cover their butt drill."

Dow Jones Industrials Ratio to Gold

As for the see-saw battle between the gold bugs and the Wall Street bulls, it is interesting to note that the Dow Jones Industrials fell to a seven year low, compared to the yellow metal. The Dow lost half of its value to gold from the September 11th terror attacks until the conquest of Baghdad in March 2003, during the second phase in the war on terror. After gyrating in a tight sideways trading range between 24 and 26, for almost three years, the Dow to gold ratio began to break down again in November 2005, falling below the February 2002 low of 21.88.

So while the recovery of the Dow Industrials since the end of the Iraqi war in March 2003 looks very impressive on paper, in "hard money" terms, the US stock market remains in a long term bear market. The latest breakdown in the Dow to gold ratio coincided with Iran's rejection of Russia's compromise proposal for averting a confrontation, and thus, possibly signaling the beginning of Phase three in the war on terror. But this time, with the EU on board the American side.

Author: sirchartsalot.com

Friday, January 20, 2006

James Turk Interview about Investing in Gold

James Turk has appeared in an interview with Julie Watson the senior editor of forbes.com. Mr Turk is the co-founder of goldmoney.com and the author of the Freemarket Gold & Money Report.

James Turk talks about the gold market, his forecast of $850 for this year and how to invest in gold. Turk also talks about paper gold, physical gold and mutual funds and the advantages and disadvantages of investing in them in this gold bull market.

Click Here to watch the short video interview on forbes.com

Monday, January 16, 2006

2006 Gold Breakout Looks Like 1979

Lars Lingren has published a very interesting set of charts which compare the gold price break out in the last gold bull market to the one taking place right now.

Lingren has shown how the gold charts in January 2006 look the same as the gold charts looked in August 1979, just before the gold price increased from $320 to $870.

The Gold Price Breakout in 1979


From 1976 to 1979 the price of gold rose within a well defined trend channel until August 1979, when gold broke above the trend channel twice hitting the $320 level. Soon after the double break out, the gold price rose to $870 US in a period of just 5 months.

From 2001 to 2006 gold has again risen within a well defined trend channel, until NOW!

Lingren points out that we are seeing the same double break of a well defined trend channel as we had in August 1979.

On December 12th, 2005 the gold price broke out of the current trend channel and it has just done it again, only this time the price of gold has broken considerably higher.

Compare the gold price charts of 1976 to 1979 and 2001 to 2006.

Get ready for the gold price to rocket to at least $850 in 2006.

Thursday, January 12, 2006

Gold Price going to $850 before the end of March 2006

With gold prices hitting 25 year highs, perhaps you are thinking now might be a good time to sell those Krugerrands, Canadian Gold Maple Leafs or American Gold Eagles you have tucked away.

Before you call up your gold dealer and get a price for your gold coins you might want to read what James Turk the author of the Freemarket Gold & Money Report is telling his readers in his most recent newsletters.

James Turk made this gold price prediction in his January newsletter:
"I do not anticipate gold will again trade below $500 ever. In other words, gold prices in the $400s are history, just like gold prices in the $300s are history."

Since the gold price broke above $500 it has risen almost 10% in a few short weeks.

James Turk's forecast comes at a time when many other so called experts on gold are calling for a top in the gold price. No doubt they will be proven wrong, just like they were proven wrong when they called for a gold price correction many times before, at prices much lower than today's gold price.

James Turk's gold price prediction for 2006 is for a new record high for gold above $850. However, what is even more interesting is what Turk said in his most recent newsletter, "I am now thinking that we might see that new record high before the end of March." wrote Turk.

So perhaps now is not such a great time to sell those gold coins after all. As James Turk told his readers "get ready for some huge and exciting fireworks."

Tuesday, January 10, 2006

John Embry of Sprott Asset Management


There is an excellent interview with John Embry, Sprott Asset Management's chief investment strategist, on a Canadian television show today called "Market Call with Jim O'Connell".

John Embry, is an industry expert in gold, he has researched the gold sector for over thirty years and has accumulated extensive experience as a portfolio manager since 1963. Sprott Asset Management now manages over half a Billion Dollars of investor funds.

When asked at what stage of the gold bull market we are in, John Embry said "we are in the early stages of the 2nd phase of a 3 phase long life bull market, and this one I think you are going to see people will finally realise why gold is a good idea."

Why is the gold price going up?

When asked why is the gold price going up? Embry said " The biggest driver which you don't see in the press at all, are the short positions. A lot of people who have been on the wrong side of the market that have been going along with the cartel are getting real uncomfortable... and starting to unwind some positions, that is against an excellent macroeconomic and geopolitical backdrop, there is a lot of things going wrong in the world that are beneficial for gold."

Bill Murphy of the Gold Anti Trust Action Committee (GATA), says the gold cartel is short as much as 10,000 tonnes of gold! Murphy believes they are panicing to cover those short positions at the moment, and that is why the gold price is taking off.

The gold cartel is losing control of the gold price.

Embry believes the achilles heel to the manipulation of the gold price by the gold cartel is their shortage of physical gold.

Embry says "The central banks have spewed a lot of gold into the market over the last 15 years, they do not have nearly what people think they have and now you have a lot of other central banks particularly China and Russia looking to add to their holdings."

Embry doesn't believe that western central bank selling is going to be a driver for gold in the next few years, simply because he believes they are running short of gold to sell into the market to suppress the gold price.

Israel, Iran and the Gold Price

John Embry was asked what would happen to the gold price if Israel decided to take out Iran's nuclear facilities. Embry said "In the old days when the gold cartel was in full bloom they would squash the gold price in this type of event just to show that gold had no impact on anything but now they are getting short on physical gold they would be overrun."

Embray predicts $100 moves in the gold price are conceivable at some point in the future. Embry says we will see moves of $20 and $30 in the gold price as the gold bull market picks up steam.

When will gold hit $600?
Embry says he expects the gold price to pass $600 in the next few months and $1000 in the next few years. Although he doesn't rule out the possibility of Bill Murhpy's prediction of $5000.

You can find John Embry's Interview at the 12:30 p.m. segment of the Tuesday ROB-TV archive here:

http://www.robtv.com/shows/past_archive.tv

You will need to watch this interview with John Embry in the next 7 days, as it will be removed from the archive at ROB-TV after that.

Tuesday, January 03, 2006

Biggest One Day Gold Price Increase in this Gold Bull Market

Today was the largest single intraday increase in the gold price that has taken place (during the regular pit session) since the gold bull market began in 2001. The gold price closed up a huge $13.30. The second biggest increase in a single day was on May 18, 2001 when gold closed up $12.65.

What makes todays gold price increase different?

When the gold price hit $543.00 on the 12th of December 2005 the gold price increased $12.80 before falling back to close up only $1.30.

Dan Norcini pointed out in Letropolecafe.com the reason why this move was different to the gold price increase on the 12th of December. Norcini said "What makes this one look different is that the big move up on Dec. 12 last year occurred with the RSI already well into overbought territory above the 80 level. We are still beneath 70 on the 14 day RSI – no where near overbought based on RSI readings for the gold market."

There has only been one day that has beaten todays gold price increase in the last 21 years which was on September 27, 1999 due to the announcement of the Washington Agreement, the gold price increased $14.20.

The difference with todays move was that there was no market moving news. The gold price is increasing on its own supply and demand fundamentals.

Sunday, January 01, 2006

2005 Gold Price

2005 will no doubt be viewed in the coming years, as being a pivotal year for the gold price. Particularly if the gold price rockets to over $750US in 2006, as many experts we wrote about in 2005, forecast it will.

The gold price surged 25% last year when it hit its highest level in nearly 25 years of US$540.90 in December 12, after spending the first eight months in a US$410-US$460 range. The average gold price in 2005 was US$444.75.

The Average Gold Price in 2005 by Quarter

2005 Q1 $427
2005 Q2 $427
2005 Q3 $439
2005 Q4 $485


Notice that nearly all of the gold price rise in 2005 took place in the last quarter, when there was an average price increase of $49 per ounce.

Annual Gold Prices for the past 5 years show that in 2005 the gold price had the biggest annual dollar increase, with an increase of over $80. This is the biggest increase since this gold bull market started in 2001. Although it was only the third largest increase in percentage terms.


Annual Gold Prices for the Past 5 Years
Year StartCloseAnnual Percentage ChangeChange in US$
2001$274.45$276.51%$2.05
2002$276.5$347.226%$70.7
2003$347.2$416.2520%$69.05
2004$416.25$435.65%$19.35
2005$435.6$515.618%$81.00


Euro Gold Price was up 34.93% in 2005
Japanese Yen Gold Price was up 35.93% in 2005


Important Gold Price Milestones in 2005


- The gold price, which traditionally moves in the opposite direction of the dollar, increased, even though the US$ climbed 15 per cent against the euro.

- The gold price broke out in in all major global currencies.

- The gold price broke above $500, for the first time in 24 years.

- Gold futures Open Interest has shown a contraction with a rising gold price. This has not occurred so far in the past 4 years of this gold bull market and may suggest the shorts are leaving the market.